Aton Resources Inc (AAN) July 2026 Snapshot: F-Grade Copper-Gold Explorer
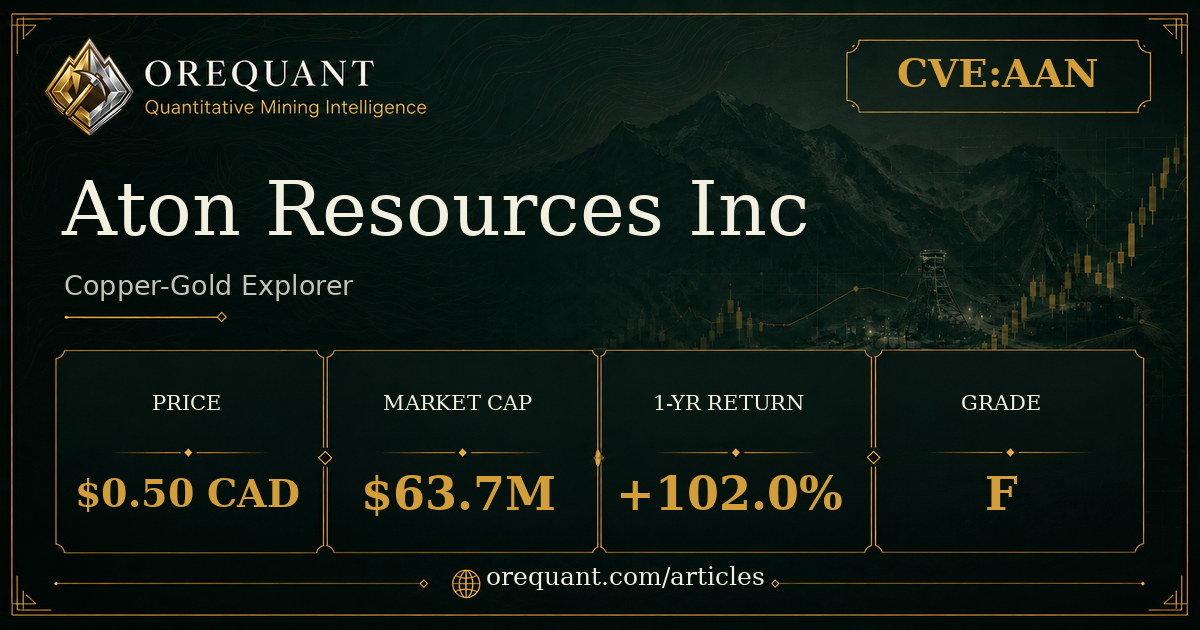
| Share price | $0.50 CAD |
|---|---|
| Market cap | $63.7M |
| 1-year return | +102.0% |
| 1-month return | -24.6% |
| OreQuant quality grade | F |
| Classification | explorer |
See the full signal depth behind this snapshot →
Snapshot Summary
Aton Resources Inc (CVE:AAN) is a pre-production gold explorer operating in Egypt, carrying an F-grade quality rating under OreQuant's grading framework. With a market cap of approximately $63.7 million USD and a share price of C$0.50, the company sits squarely in small-cap explorer territory, where binary exploration outcomes drive most price action.
AAN's one-year price performance of 102% is the headline number — but the one-month pullback of 24.58% complicates the momentum picture. A gain of that magnitude over twelve months, followed by a retracement of nearly a quarter in a single month, is not an unusual pattern for pre-revenue explorers.
These are expected characteristics for an active explorer — but they do mean the company depends entirely on external capital to advance its projects. The explorer archetype , as defined in the public data, describes a pre-production company focused on exploration and resource definition that may require external capital to advance.
The public data carries an affirmative financing risk flag within one year. Combined with zero revenue and an ongoing net loss, that flag represents a concrete capital constraint on the near-term development timeline. Meeting that requirement — whether through equity issuance, debt, or a strategic partnership — will be a defining variable for the company's operational trajectory. AAN is classified as a copper-gold hybrid, reflecting meaningful base-metal exposure alongside its primary gold narrative.
The F-grade designation reflects the relative OreQuant rating band based on current public-data scoring. As the supplied definition notes explicitly, it does not independently establish management quality, financing capacity, operational maturity, or balance-sheet strength — it is a signal within a broader analytical framework, not a standalone judgment.
Operations and Footprint
Every asset sits within a single jurisdiction, concentrating the company's geopolitical and regulatory exposure entirely on that country. The public data records Colombia and South America in the geographic profile alongside Africa, but all five named projects are Egyptian assets: Kab Amira, Hamama Deposit, Rodruin Deposit, Hamama West, and Abu Marawat. Single-jurisdiction concentration is a structural characteristic common among early-stage explorers — operational focus is often a prerequisite for managing limited capital — but it means that any adverse regulatory or permitting development in Egypt affects the entire asset base simultaneously, with no geographic offset available.
The commodity classification is copper-gold hybrid, meaning the portfolio carries meaningful exposure to both metals simultaneously. The copper resource stands at 49 million pounds across approximately 2.9 million metric tonnes of resource tonnage. For an explorer of this size and market-cap range, that base-metal component is material to how the company's economics would ultimately be framed at development stage. When copper prices move through sustained cycles — whether driven by industrial demand signals, inventory builds, or macro growth expectations — the AAN portfolio responds to pressures beyond the gold market alone.
The 120-day copper beta of approximately 0.49 quantifies how closely AAN's price has tracked copper movements over that measurement window. A beta near 0.5 indicates moderate co-movement — copper price cycles influence AAN's trading behavior, but the relationship is not one-for-one. This is a meaningful distinction for investors using AAN primarily as a gold-exposure vehicle. When gold and copper diverge in macro regimes, AAN's dual exposure means neither metal fully anchors the share price. The partial copper beta introduces a second variable into return attribution that a pure-play gold explorer would not carry.
No production timeline is recorded in the public data, consistent with the pre-production explorer archetype. The absence of a production estimate is not unusual at this stage — resource definition and permitting typically precede any formal feasibility or construction timeline — but it underscores that the company remains entirely in an exploration-stage capital-consumption phase rather than a revenue-generating one.
OreQuant scores every company across 11 signal layers, updated daily. Start Your 7-Day Free Trial to see the full breakdown behind this snapshot.
Financial and Market Position
Aton Resources had approximately 127.5 million shares outstanding at the time of the market snapshot, giving the company a market cap and share price noted in the Snapshot above. For a pre-revenue explorer at this scale, even moderate volume shifts can produce outsized price moves — both to the upside and the downside, as the recent one-month drawdown illustrates.
This is structurally normal for an active explorer, but it tightens the financing runway materially. The affirmative financing risk flag indicates the company faces a capital-raise requirement within one year — a concrete constraint, not a probabilistic one. The nature of that raise, and the terms on which it occurs, carries significant implications for existing shareholders. Debt arrangements introduce interest burden into an already negative income statement. Strategic partnerships or joint ventures may provide capital but alter control and future economic participation in the underlying assets.
Within the peer cohort, AAN's one-year return places it second behind Avanti Gold Corp (CNSX:AGC), which posted a dramatically higher gain from a comparable market-cap base. On the other end, Soma Gold Corp (CVE:SOMA) declined 43.07% over the same period. Canterra Minerals (CVE:CTM) returned 63%, while Yandal Resources (ASX:YRL) and Far East Gold (ASX:FEG) both recorded flat performance at 0%. AAN's result is strong relative to most peers, but the gap to Avanti Gold's outlier move signals significant dispersion within the cohort — a reminder that at this market-cap tier, idiosyncratic company-level catalysts dominate cohort-wide factors.
Peer market caps cluster tightly — all five comparable companies sit between approximately $62.9 million and $65.1 million USD, making this a genuinely size-matched comparison. Within that narrow band, performance diverges sharply, underscoring that company-specific exploration results, financing events, and permitting milestones drive returns far more powerfully than index-level or sector-level forces at this scale.
Why It Matters Now
The combination of a strong one-year gain followed by a sharp one-month pullback places AAN at a momentum inflection. Whether that move represents exhaustion or consolidation depends on what catalysts emerge next — and at the explorer stage, those catalysts are almost entirely project-driven rather than macro-driven.
The single-jurisdiction concentration in Egypt remains the most direct structural risk to monitor. Regulatory, permitting, or geopolitical developments in that one country affect the entire portfolio with no geographic offset. Egypt's mining regulatory environment has been evolving, and any changes to concession terms, royalty structures, or operating agreements would land across all five projects simultaneously. That concentration is not inherently disqualifying for an explorer — many successful single-jurisdiction developers have operated within comparable frameworks — but it means the risk surface is undiversified in a way that broader portfolio construction would need to account for.
The financing requirement within one year represents a near-term decision point that will shape the company's capital structure and dilution profile regardless of how exploration progresses. A successful raise under favorable terms extends the operational runway and preserves optionality. A raise under pressure — or a failure to secure capital — has the opposite effect.
The copper-gold hybrid classification carries a specific implication for signal interpretation. When gold and copper diverge — as they have during periods where industrial demand concerns weigh on copper while safe-haven demand supports gold — AAN's price action does not cleanly track either commodity. Investors following a gold-only macro thesis may find the copper beta introduces noise into that relationship. Conversely, if copper demand strengthens while gold consolidates, AAN could see base-metal tailwinds that a pure-play gold explorer in the same jurisdiction would not capture. The dual-commodity structure creates asymmetric exposure to macro scenarios in ways that single-commodity peers do not exhibit.
At this stage of development, the primary price-moving variables remain exploration-driven: resource expansion drilling, updated resource estimates, and permitting progress at the Egyptian projects. The 49-million-pound copper resource alongside the gold portfolio gives AAN a multi-commodity story to develop — but resource definition and the path from exploration to a production decision remain the operational work ahead.
Sector peer comparison
| Company | Ticker | Market cap | 1-yr return | Grade |
|---|---|---|---|---|
| Yandal Resources Ltd | YRL | $63.5M | — | F |
| Soma Gold Corp | SOMA | $62.9M | -43.1% | C |
| Canterra Minerals Corp | CTM | $62.9M | +63.0% | F |
| Far East Gold Ltd | FEG | $64.6M | — | D |
| Avanti Gold Corp | AGC | $65.1M | +1671.0% | D |
Peers ranked by market-cap proximity within the same commodity and producer tier. Market data and quality grades are public; OreQuant's full signal-layer scores are subscriber-only.
Frequently Asked Questions
What commodity exposure does Aton Resources (CVE:AAN) carry?
AAN is classified as a copper-gold hybrid. The company holds a disclosed copper resource of 49 million pounds across approximately 2.9 million metric tonnes of resource tonnage, alongside its primary gold narrative. The 120-day copper beta of approximately 0.49 reflects moderate co-movement with copper price cycles.
Where are Aton Resources' projects located?
All five of AAN's named projects — Kab Amira, Hamama Deposit, Rodruin Deposit, Hamama West, and Abu Marawat — are located in Egypt. The company's geographic profile also records Colombia and South America, but the project list is entirely Egyptian, concentrating regulatory and geopolitical exposure in a single jurisdiction.
What is AAN's quality grade and what does it mean?
AAN carries an F-grade under OreQuant's grading framework. Per the supplied definition, this is a relative rating band based on current public-data scoring. It does not independently establish management quality, financing capacity, operational maturity, or balance-sheet strength.
How did AAN's one-year return compare to its peers?
AAN's 102% one-year return placed it second in its peer cohort. Avanti Gold Corp (CNSX:AGC) led with a dramatically higher gain, while Canterra Minerals (CVE:CTM) returned 63%, Yandal Resources (ASX:YRL) and Far East Gold (ASX:FEG) were flat at 0%, and Soma Gold Corp (CVE:SOMA) declined 43.07%.
Risk & Disclosure
Copper-Gold mining equities carry substantial risk including commodity-price volatility, operational disruptions, jurisdictional changes, and capital allocation missteps. Senior producers mitigate some risks through diversification and scale, but remain sensitive to metal prices, cost inflation, and geopolitical developments. Junior and exploration-stage companies carry additional risk including total loss of capital. Past performance does not predict future results.
Investors should be prepared for double-digit intraday swings and should conduct independent due diligence, assess risk tolerance, and consult a licensed financial professional before initiating or modifying positions in mining equities.
OreQuant is not a registered investment advisor. This content is for informational and educational purposes only. It is not investment advice. Always conduct your own due diligence and consult a licensed financial professional before making investment decisions. Mining equities — especially juniors — carry substantial risk including total loss of capital.
Subscribers access the full signal depth behind this snapshot — individual scores, insider cluster details, Monte Carlo valuation, and position sizing updated daily. Start Your 7-Day Free Trial.